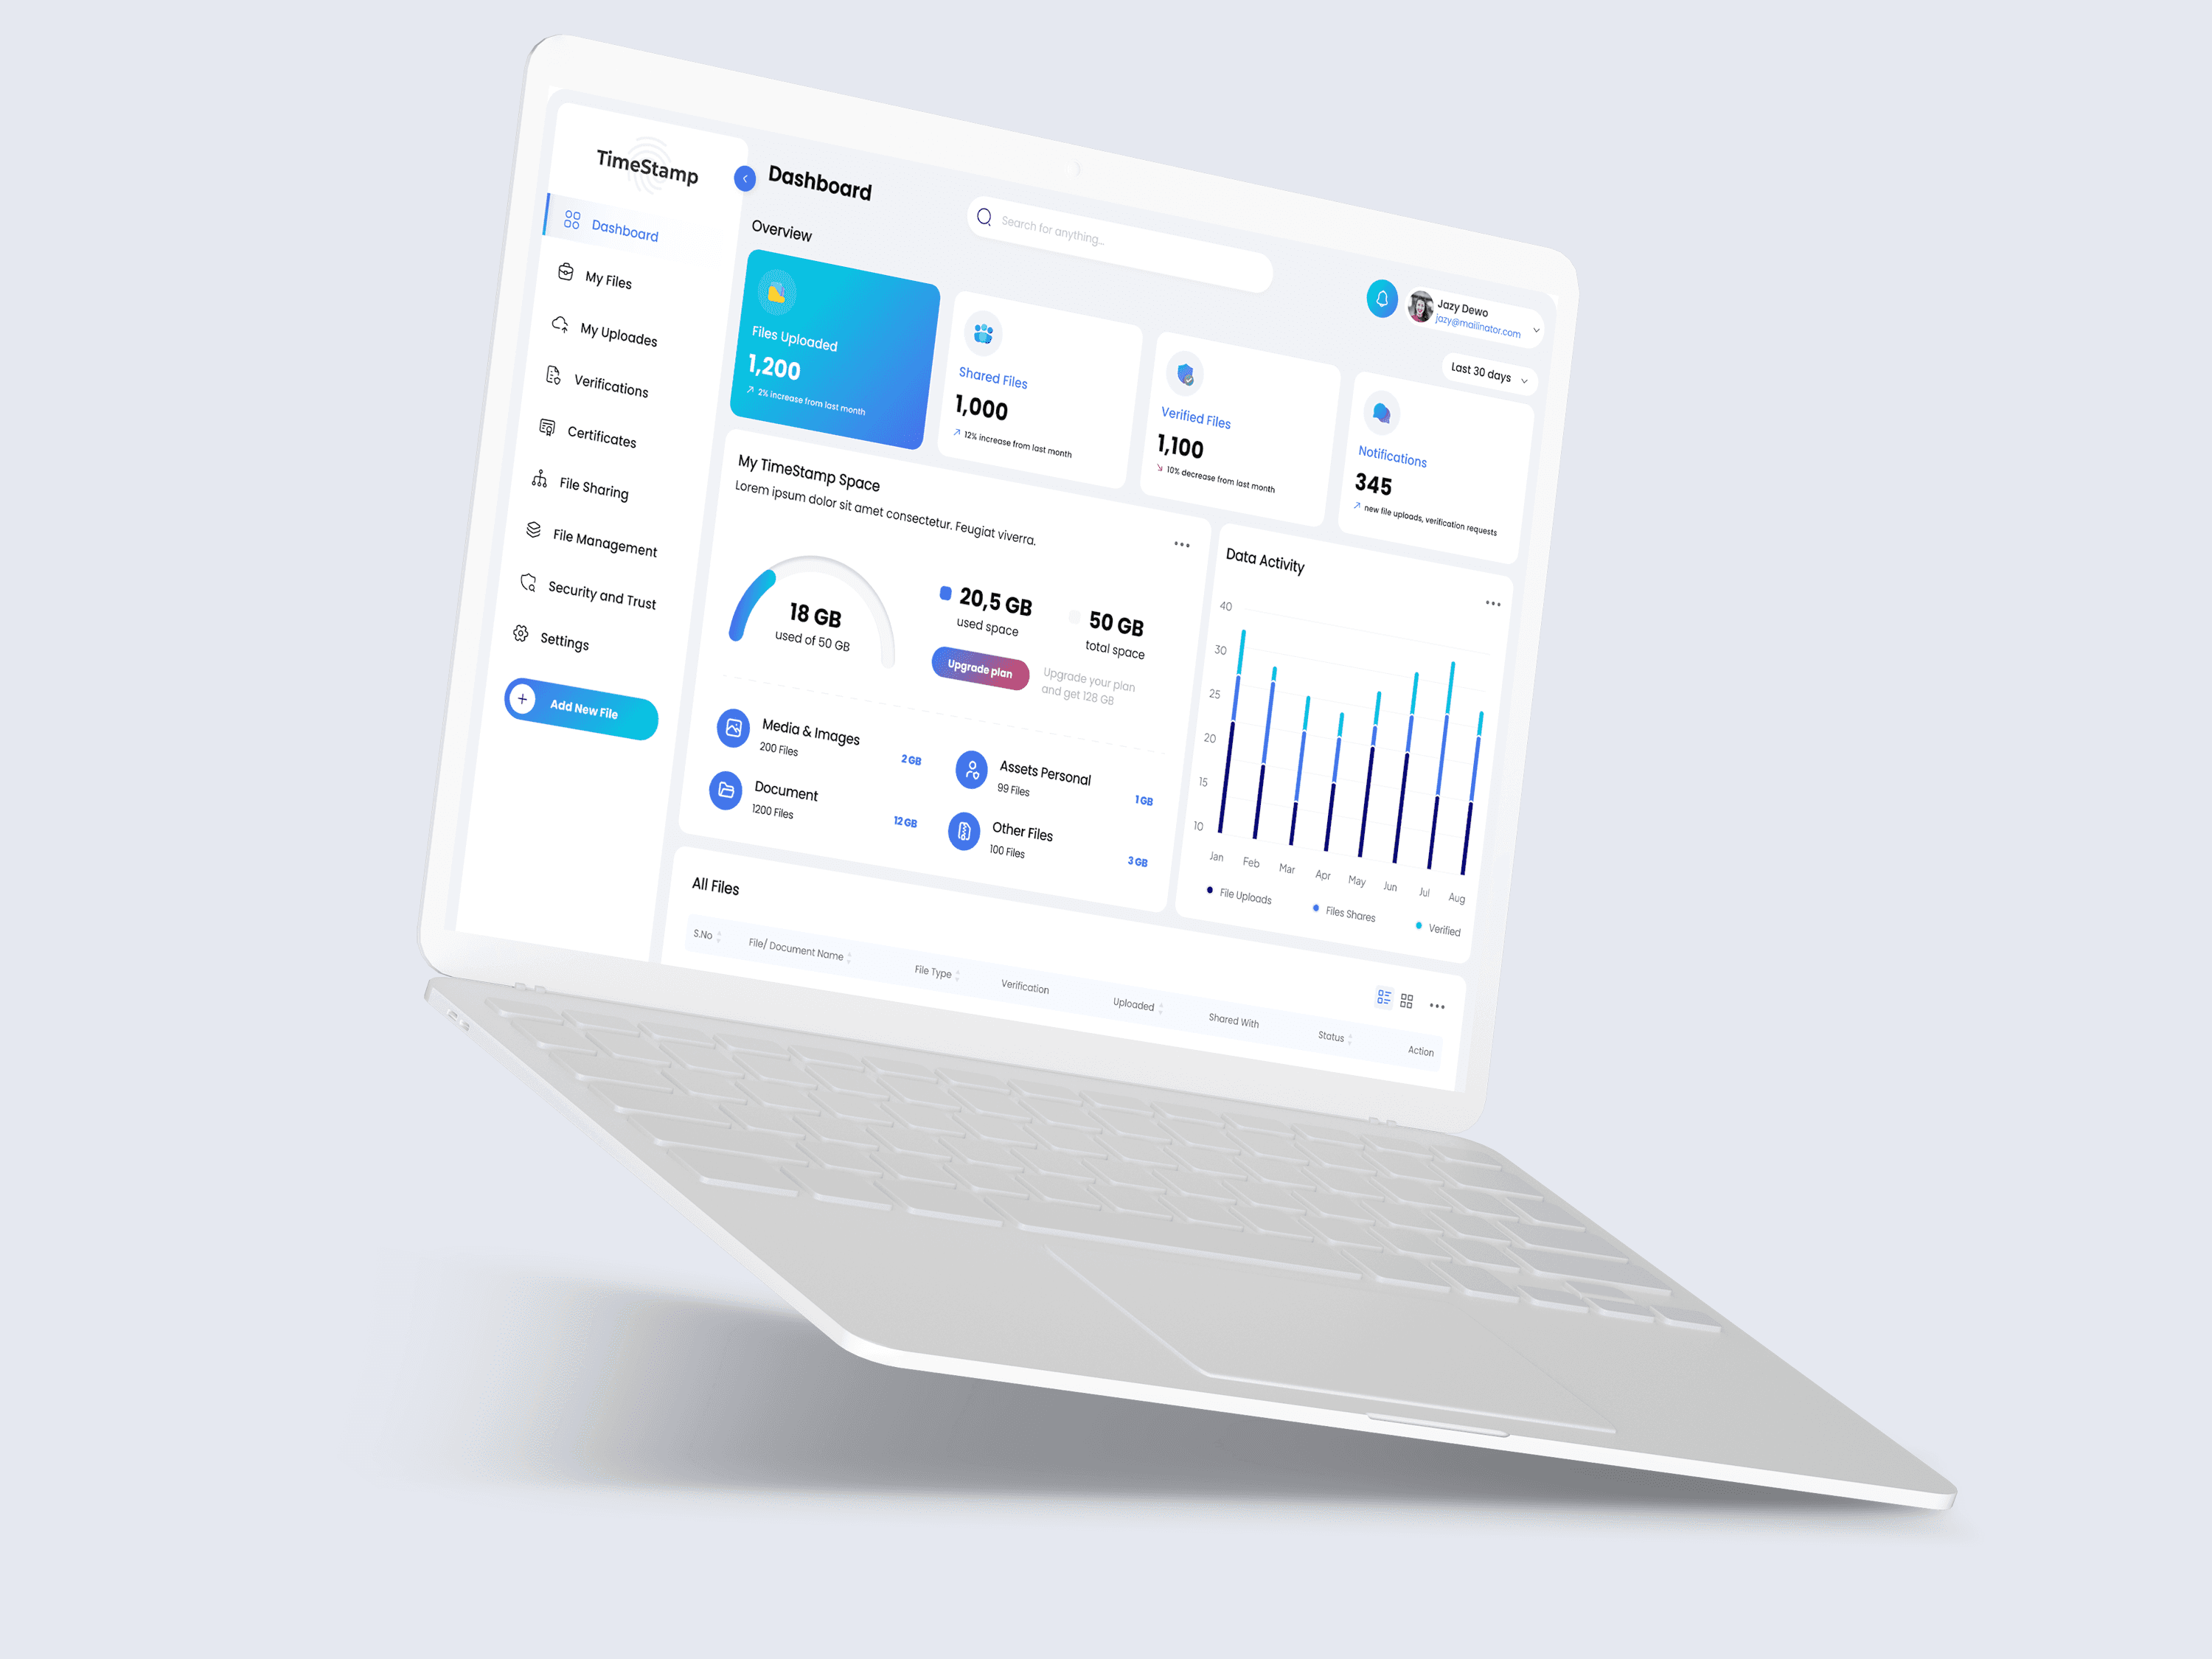
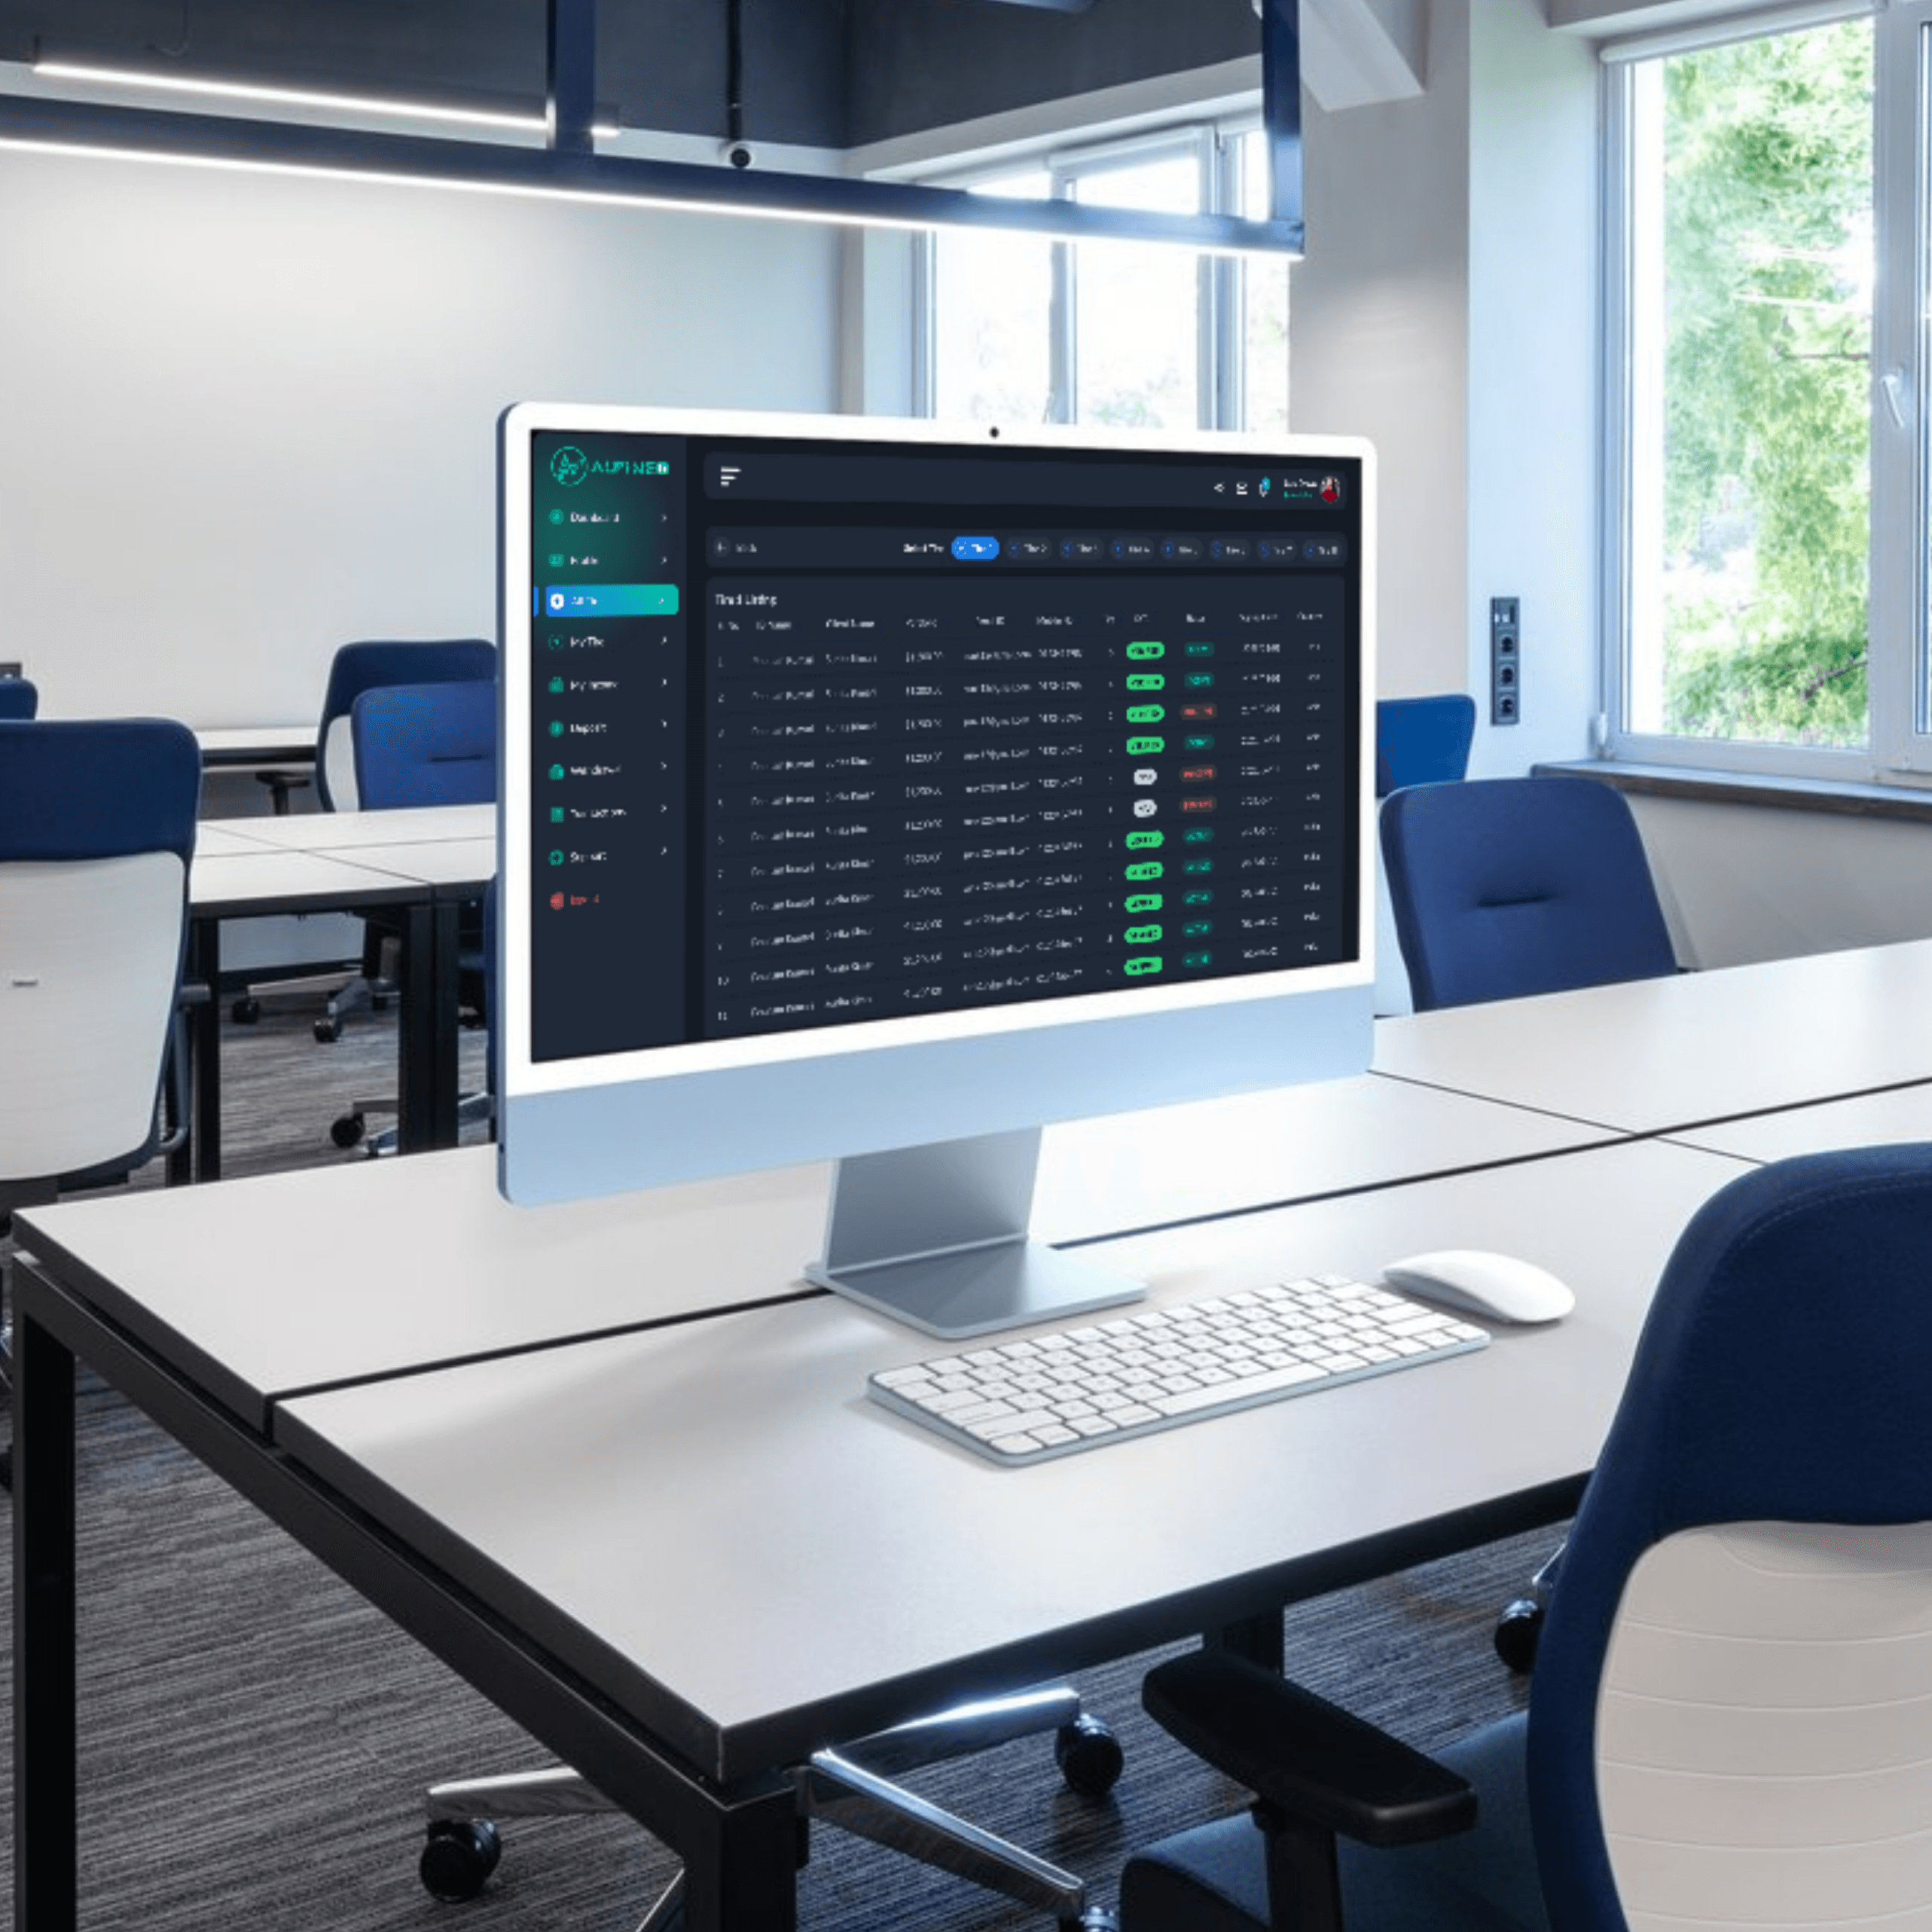
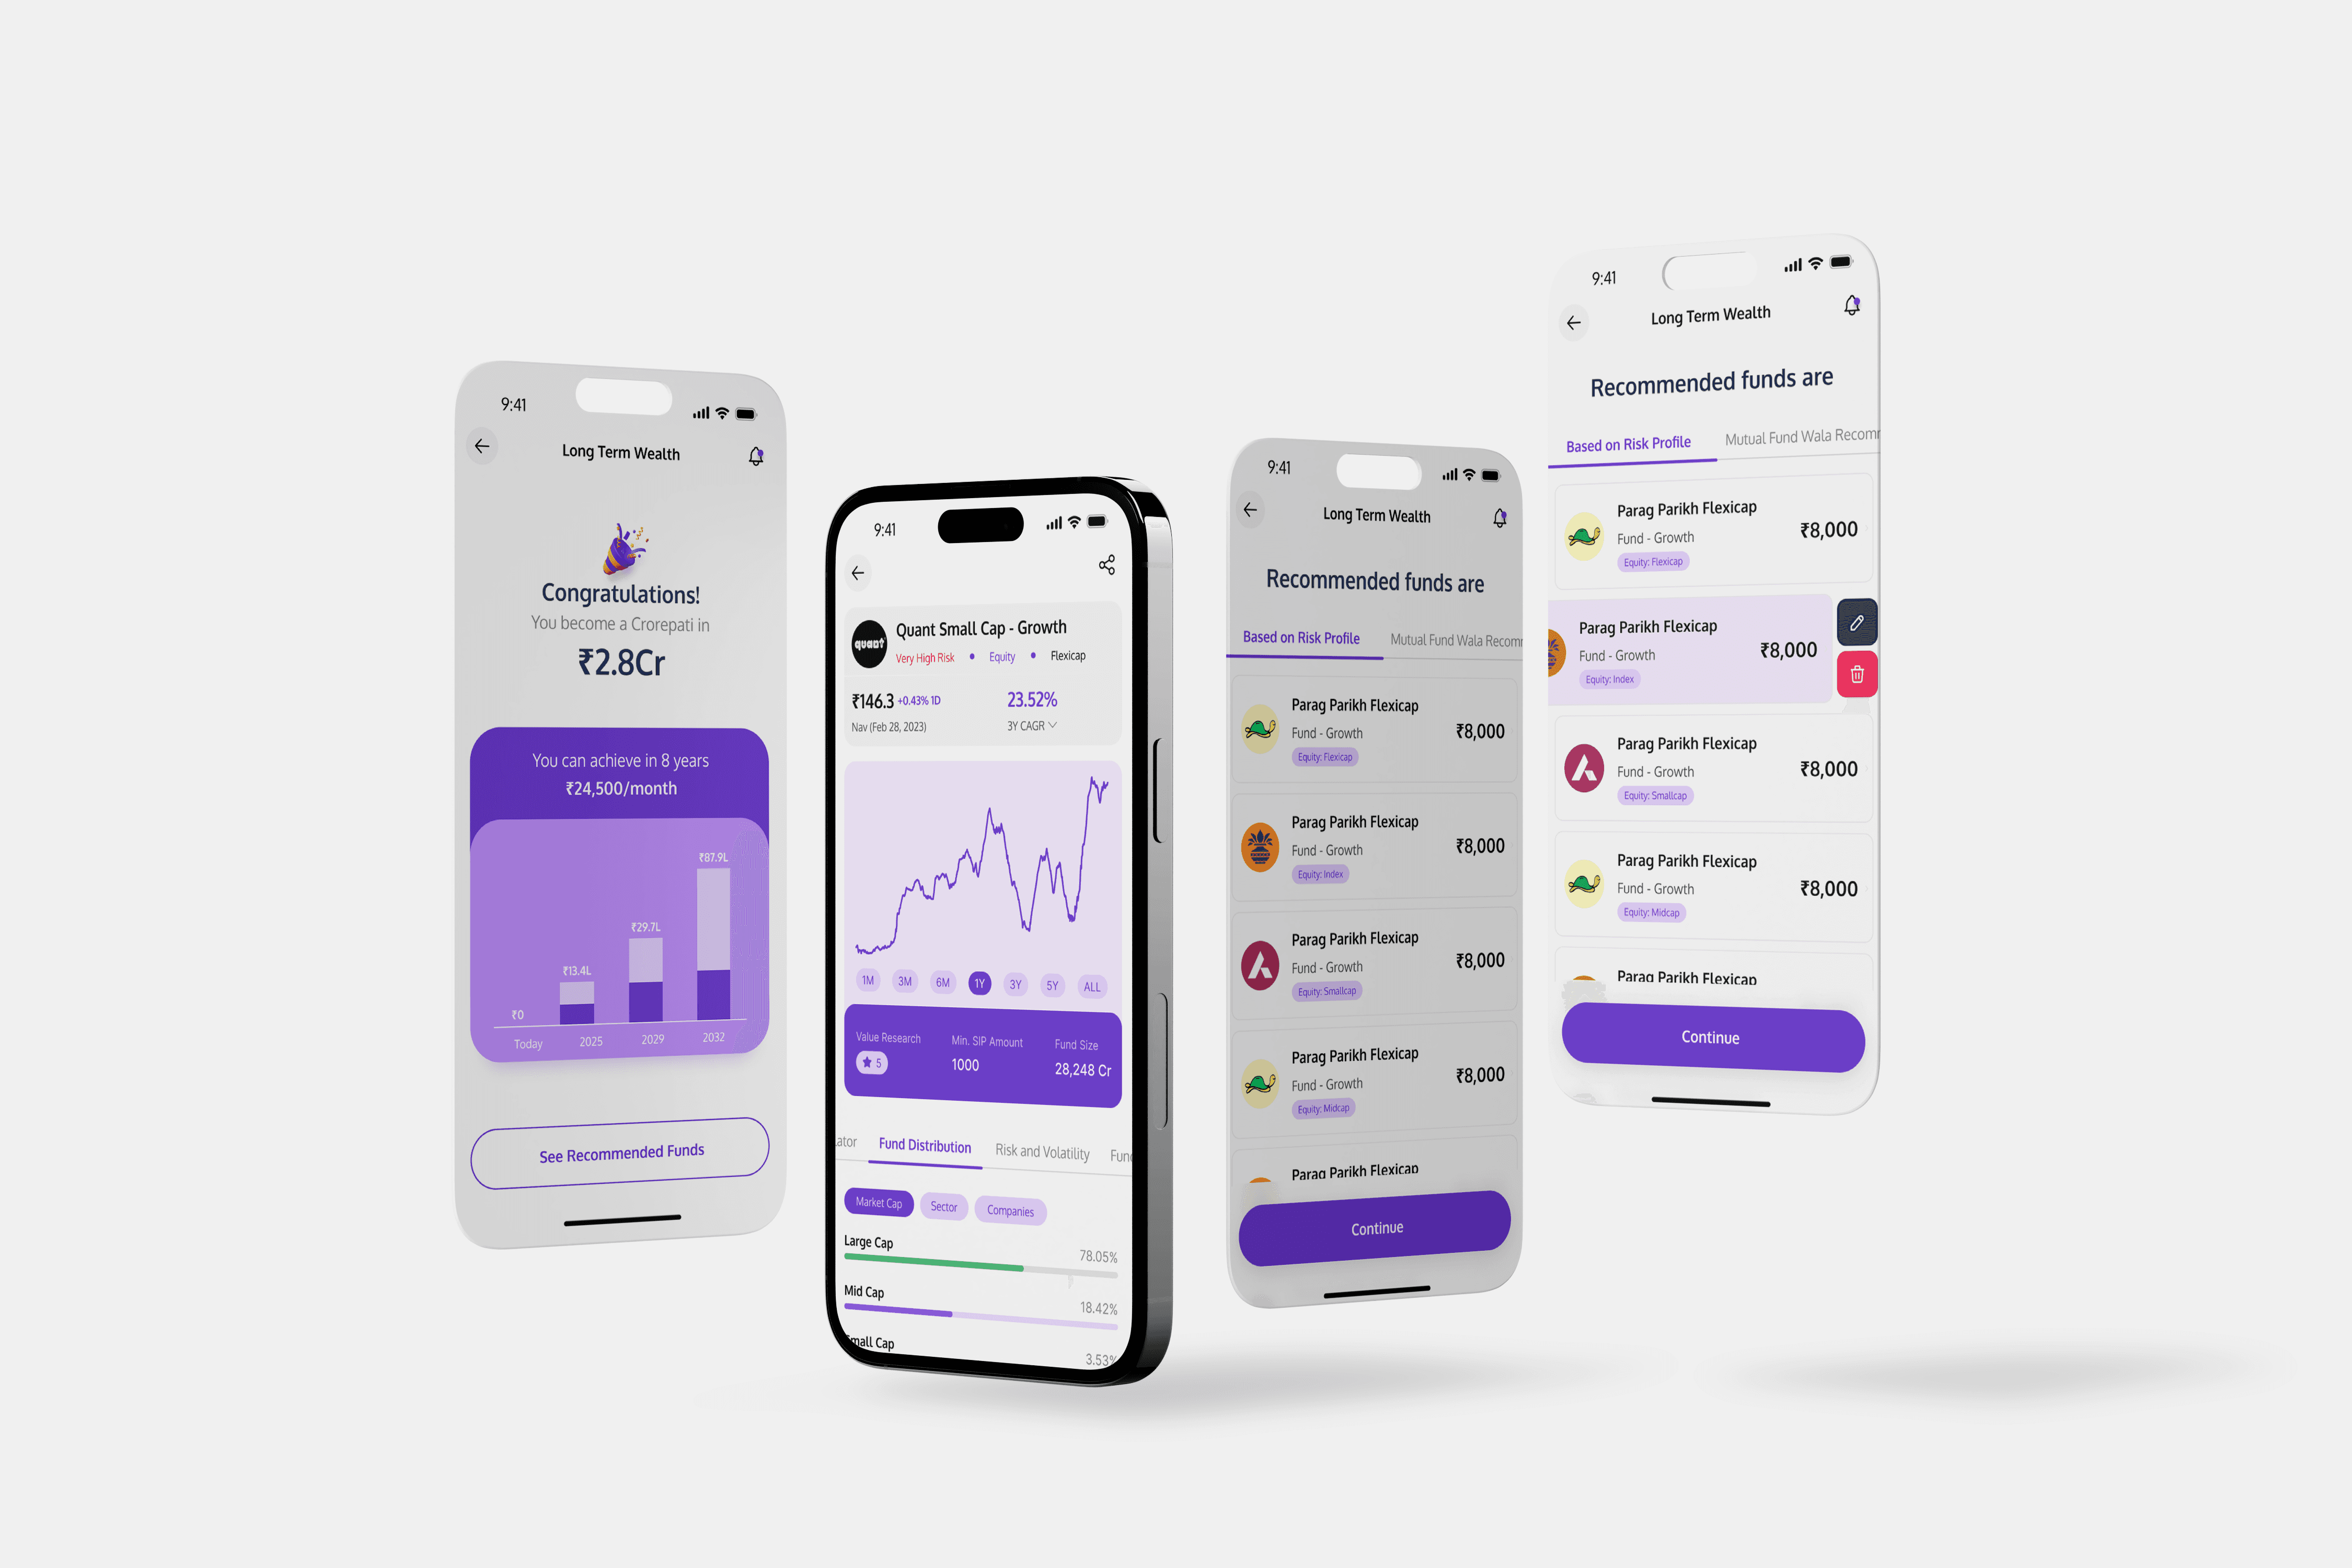
Dashboard System Design
Data becomes useful when it evolves into actionable insights through intuitive design and user-centric interfaces.
Year:
2017 - Current
Timeframe:
1 Month - 3 Month
Tools:
Figma, Photoshop, Illustration, Adobe XD, Invision
Category:
Dashboard


Overview
At DADEVAL our dashboard systems design embody coherence and functionality. Our solutions, aimed at seamless integration and easy navigation, change user experiences by transforming data into actionable insights.
Crafting Actionable Insights:- When it comes to designing an effective dashboard system we follow a systematic approach, ensuring that user needs align with data functionality. Here are the main phases defined in crafting a functional and user-centric dashboard. 1. Define Objectives and Users 2. Requirements and Data Collection 3. Design Layout and Prototypes(BrnadBook, Color Theory & Typo, Complete Figma Design Kit) 4. UI and Functionality Design 5. Frontend & Backend Development and Integrations 6. Test. Refine. Deploy.